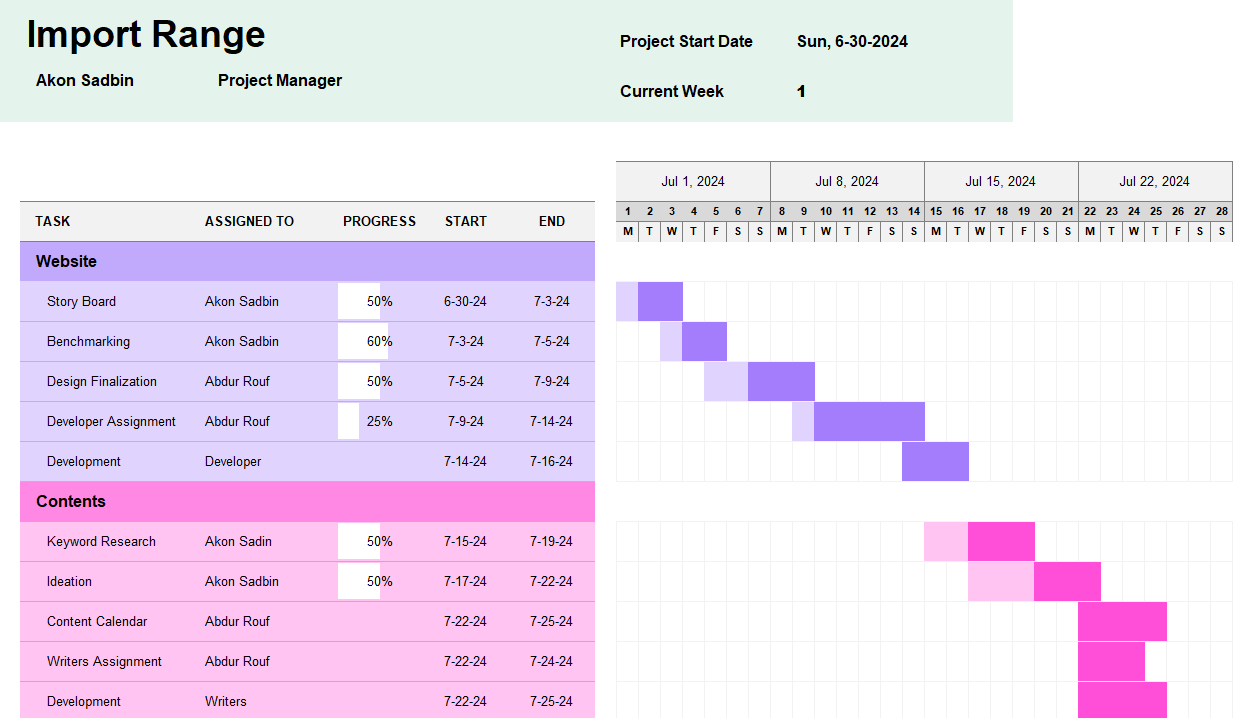
If you’re planning a project, whether as a student, as a project manager, or for a personal project, a Gantt Chart can be a very helpful tool for you. It can be particularly effective in visualizing where the project is at, and making an estimation as to how long each component of the project might take. This downloadable Excel Gantt Chart template should save you the time required to create one from the scratch, and help you start planning your project right away.
Required Tools
The template is specifically made for any version of Microsoft Excel. The same template should work with Google Sheets as well with some minor changes.
Formulas / Functions Used
This template uses TODAY, WEEKDAY, LEFT, and TEXT functions in different cells. It also has a number of custom formulas and conditional formatting throughout the worksheet.
Gantt Chart Template in Excel
The template has three sections:
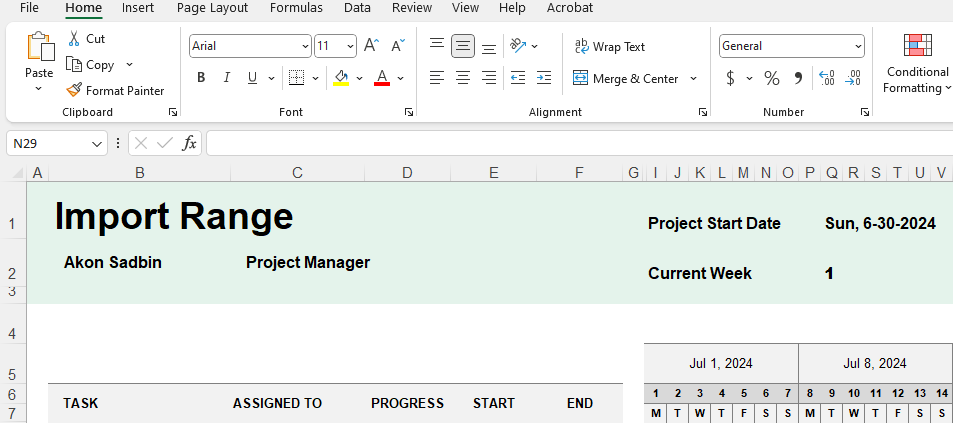
- The Project Header: Here the user will put the names of the project and the project manager, project start date, and the current week.
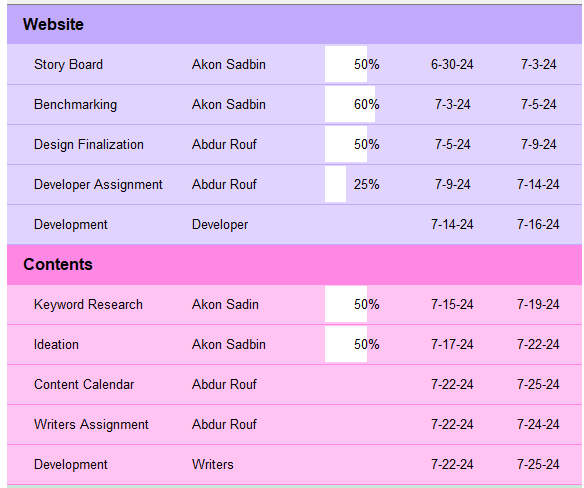
- Tasks and Subtasks: This section consists of several tasks and subtasks. The project manager needs to put the name of the assigned person, the progress percentage, and the start and end date of each task in this section.
- The Timeline Chart: This section graphically shows the timeline and the progress of each task. The graphs updates automatically from the input of the project manager in the previous section.

How to Use the Template
Firstly the user will have to put the names of the project and the project manager in the header. The user may also opt to keep these fields blank. Then, the user will input the project start date and the current week. It’s mentionable that the timeline chart will auto-scroll and adjust based on these two particular inputs.

Next, the user will have to input the tasks, subtasks, progress, and timelines. It’s important to mention that the chart will update itself based on the input of the progress percentage and timelines here.

If the user needs to add more rows, they must be above row 35, as marked in the template. Once these are done, the template should be good to go. For the default project start date, the TODAY function has been used, and the default current week has been assumed to be 1. While the project start date will ideally remain constant, the user will have to update the current week from time to time.
Printing the Gantt Chart
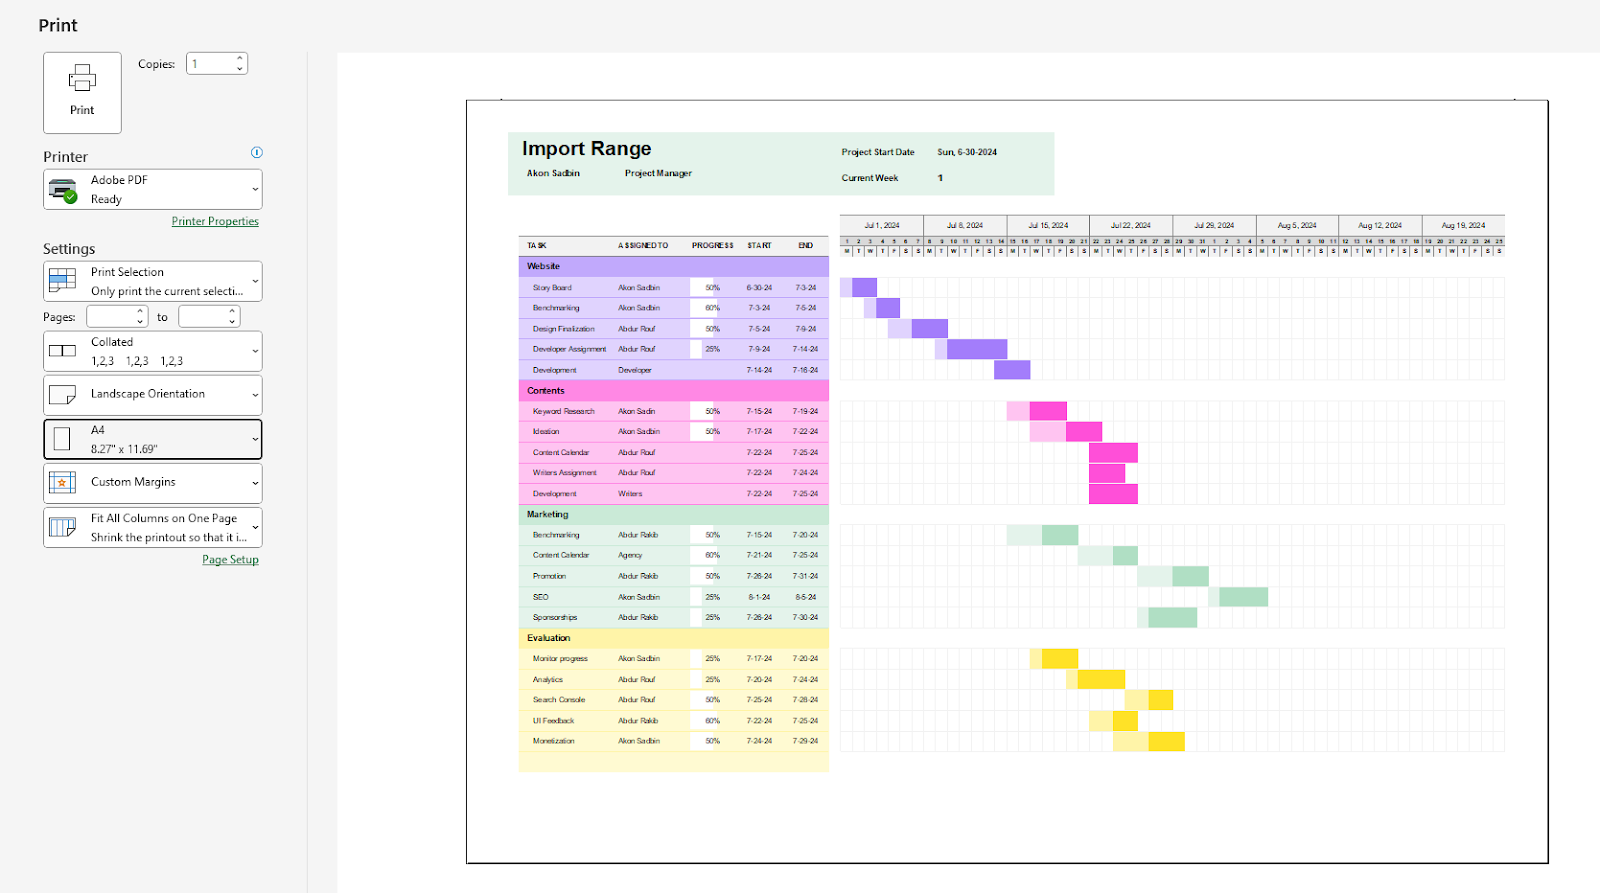
To print the Gantt Chart, we will select the specific range the calendar is in, press Ctrl + P, choose ‘Print Selection’ from the settings and click on Print.

Learn More
Here are some similar templates that you may find interest in:
- Excel Academic Calendar Template
- Excel Invoice Template
- Excel Bills Payment Template
- Excel Student Attendance Template
Conclusion
So here’s the Excel Gantt Chart Template and how to use it. If you have any queries regarding this or anything related to spreadsheets, feel free to let us know in the comments or through the Contact page.


