The AVERAGE function is one of the most commonly used statistical functions in Excel, which is used to calculate the arithmetic mean of two or more numerical values. Almost every Excel sheet that involves data reporting or financial tracking will require finding averages one way or another.
In this article, you will learn how to use the AVERAGE function to calculate averages efficiently in Excel.
Required Tools
The tutorial is specifically made for any version of Microsoft Excel. The same steps should work with Google Sheets with some minor changes.
AVERAGE Function in Excel
Syntax
=AVERAGE(Number1,Number2, …)
Number1: The first number, cell reference, or range you want to average.
Number2: The second number, cell reference, or range you want to include.
(You can include up to 255 numbers or ranges with this function.)
This means:
- =AVERAGE(10, 20) calculates the average of the numbers 10 and 20 (returning 15).
- =AVERAGE(A1, A2) calculates the average of the values inside cells A1 and A2.
- =AVERAGE(A1:A5) calculates the average of the values within the range A1:A5, meaning cells A1, A2, A3, A4, and A5.
- =AVERAGE(A1:A5, B1:B5) calculates the combined average across both ranges A1:A5 and B1:B5.
Why Use =AVERAGE(A1:A5), and Not =(A1+A2+A3+A4+A5)/5?
There are several major practical benefits to using the built-in AVERAGE function over manual arithmetic formulas:
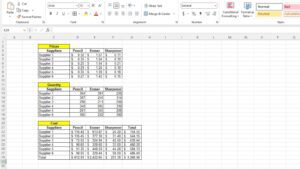
- Ease of application: When finding the mean of large datasets, it is extremely tedious and prone to human error to manually type out formulas like =(278.23+245.13+567.23)/3. Putting data in separate cells and using the AVERAGE function saves immense time.
- Automatic handling of blank cells and text: If any cell in a manual formula range is blank or accidentally contains text, a formula like =(A1+A2+A3)/3 may return an incorrect calculation (by dividing by 3 when there are only 2 values) or trigger a #VALUE! error. The AVERAGE function automatically ignores blank cells and text entries, dividing only by the count of actual numerical values!
- Dynamic updating when inserting rows or columns: Manual division formulas will not automatically adjust their divisor (the number you divide by) if a new row or column is inserted into your dataset. The AVERAGE function, on the contrary, automatically updates both the sum and the item count dynamically as long as inserted rows remain inside the reference range.
Practice
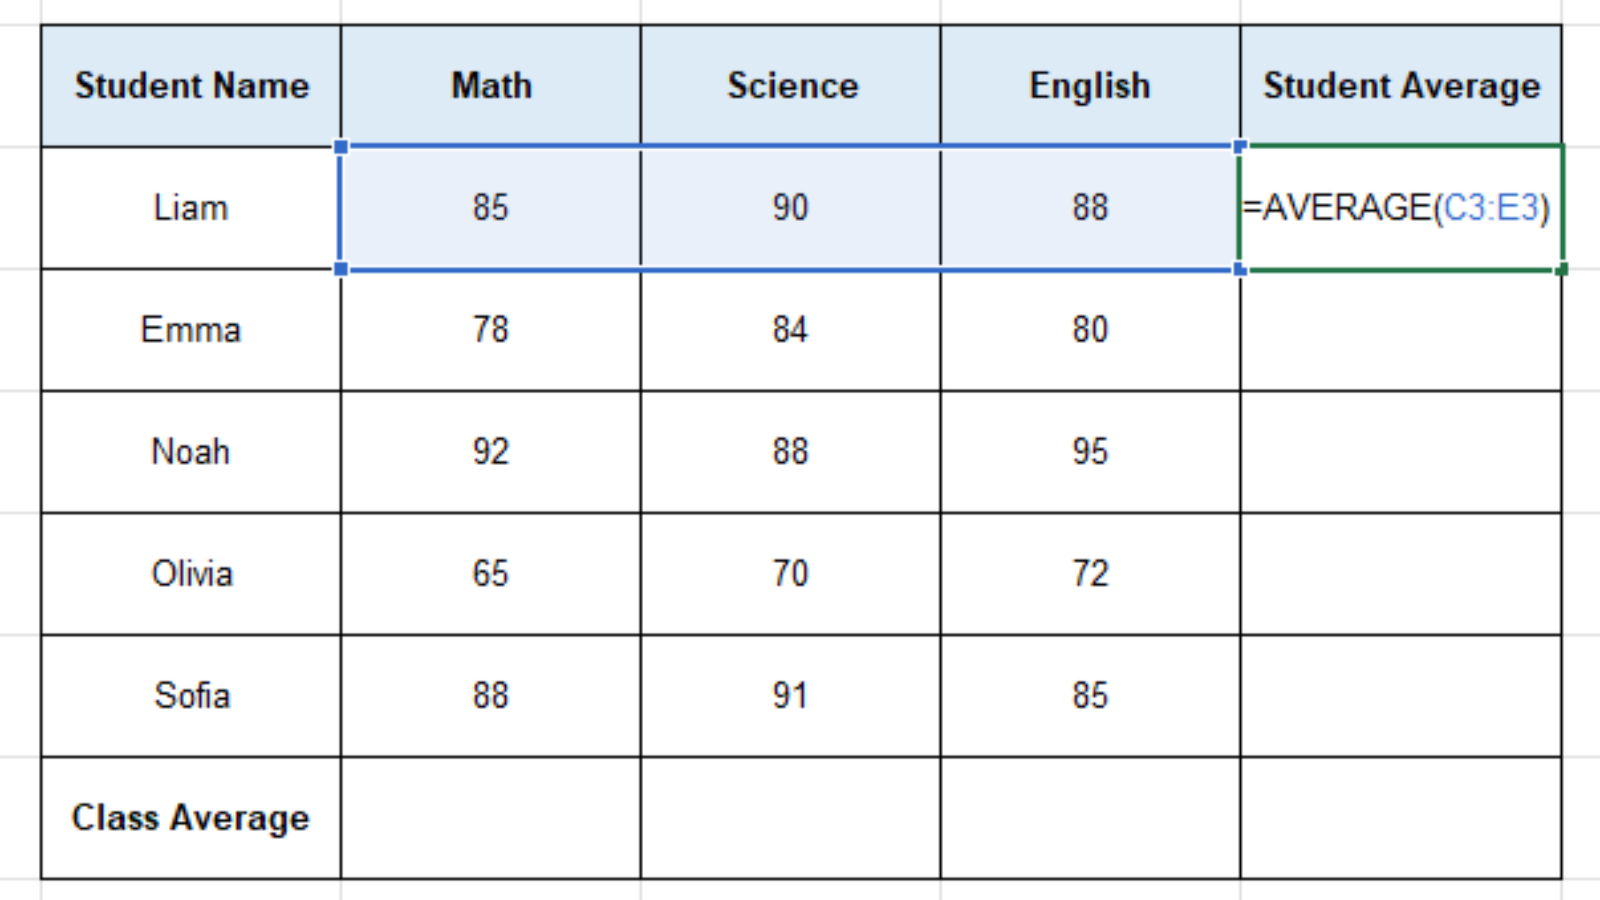
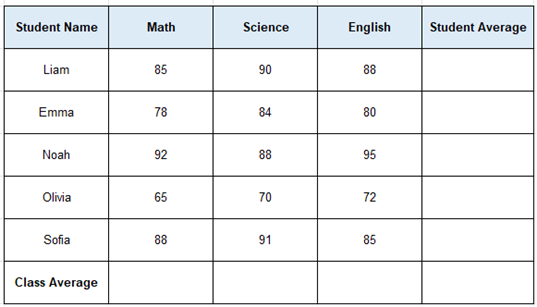
Let’s say we have a Term Examination Score Sheet for students in a high school class.
We have the student names in Column B, and their exam marks across three subjects (Math, Science, and English) in Columns C, D, and E. We need to complete the report by calculating the Average Score for each individual student, and subsequently finding the Subject Average across the entire class.
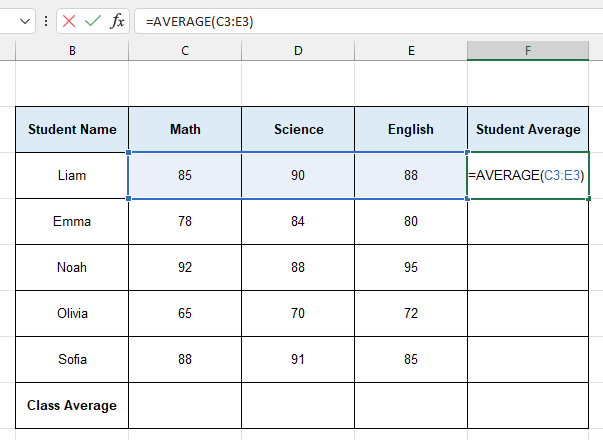
To calculate the average score for our first student (Liam), we will use the formula =AVERAGE(C3:E3) in cell F3. What this basically does is sum the values in cells C3, D3, and E3, divide them by 3, and display the resulting average in cell F3.
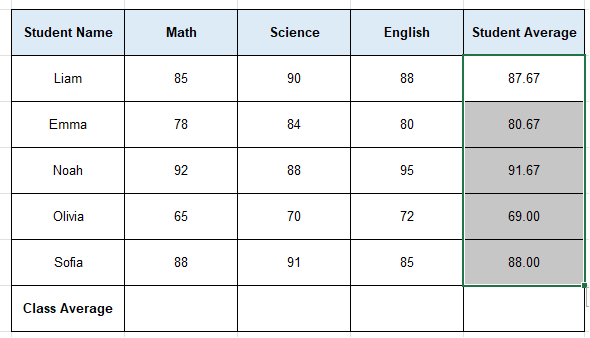
Now, to calculate the average scores for the rest of the students, we will copy the same formula down to the range F4:F7. We can do this using any of the following approaches:
- Select cell F3, press Ctrl + C, then select the range F4:F7 and press Ctrl + V.
- Select cell F3, press Ctrl + C, then select the range F4:F7 and press the Enter key.
- Select cell F3, wait for the ‘crosshair’ fill-handle icon to appear at the bottom-right corner of the cell, and drag the formula down to F7.
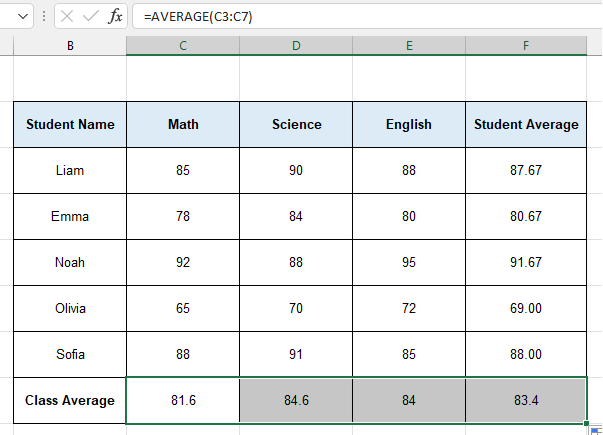
Finally, to calculate the overall Class Average for each subject at the bottom of our table, we enter the formula =AVERAGE(C3:C7) into cell C8, and copy that formula across to the range D8:F8.
Now, our completed exam report table should look like this:
Learn More
Here are some similar tutorials that you might find interesting:
Conclusion
So here is how you use the Excel AVERAGE Function. If you have any queries regarding this formula or anything related to spreadsheets, feel free to let us know in the comments or through our Contact page.